
When you begin using an oscilloscope, it can feel overwhelming because of all the controls and complex signals. The key is to focus on the basic voltage versus time graph, which shows how the voltage changes over time. Learning to interpret this simple 2D display helps you understand signal behavior, troubleshoot issues, and build confidence. Keep exploring, and you’ll uncover more about how these signals reveal circuit health and function.
Key Takeaways
- The voltage vs. time graph is fundamental for understanding how signals behave on an oscilloscope.
- Recognizing basic waveforms like sine, square, and complex shapes simplifies initial interpretation.
- Adjusting vertical and horizontal scales helps clarify signal amplitude and timing, making the graph less intimidating.
- Learning to read waveform shapes quickly indicates signal stability or faults, easing diagnosis.
- Mastering this core graph creates a foundation for understanding all other oscilloscope functions.
Have you ever wondered how engineers visualize electrical signals? It’s a common question for anyone new to oscilloscopes. When you first turn one on, everything can seem overwhelming—the multiple controls, the jagged lines, the complex readouts. But don’t worry. The key to mastering the device lies in understanding one fundamental graph: the waveform. This simple yet powerful visualization forms the foundation of signal analysis and waveform interpretation.
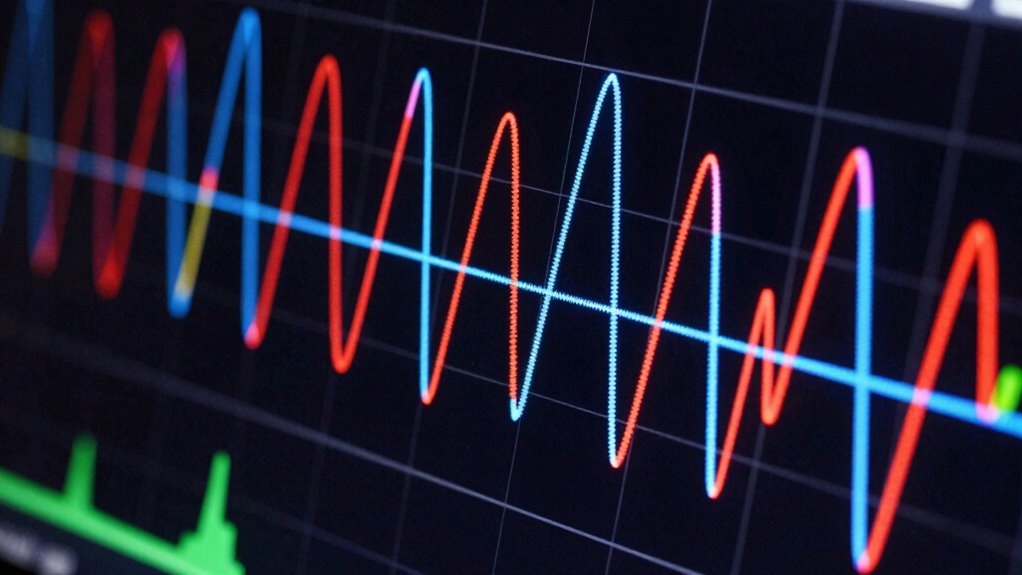
At its core, an oscilloscope displays a two-dimensional graph with voltage on the vertical axis and time on the horizontal. When you connect a signal, the scope shows how the voltage varies over time. This waveform reveals critical information about the signal’s behavior, whether it’s a sine wave, square wave, or more complex pattern. By focusing on this first graph, you can start making sense of what the device is telling you, without getting lost in the clutter of advanced features.
Learning to read this waveform is your first step toward understanding more intricate signals. You’ll notice the amplitude, which indicates the signal’s strength, and the period or frequency, which shows how often the wave repeats. Recognizing these basics helps you analyze signals more precisely, whether you’re troubleshooting electronics or designing circuits. Instead of feeling overwhelmed by the scope’s many controls, keep your attention on how the waveform changes. Adjust the vertical and horizontal scales to clarify details in the pattern—this is signal analysis in action.
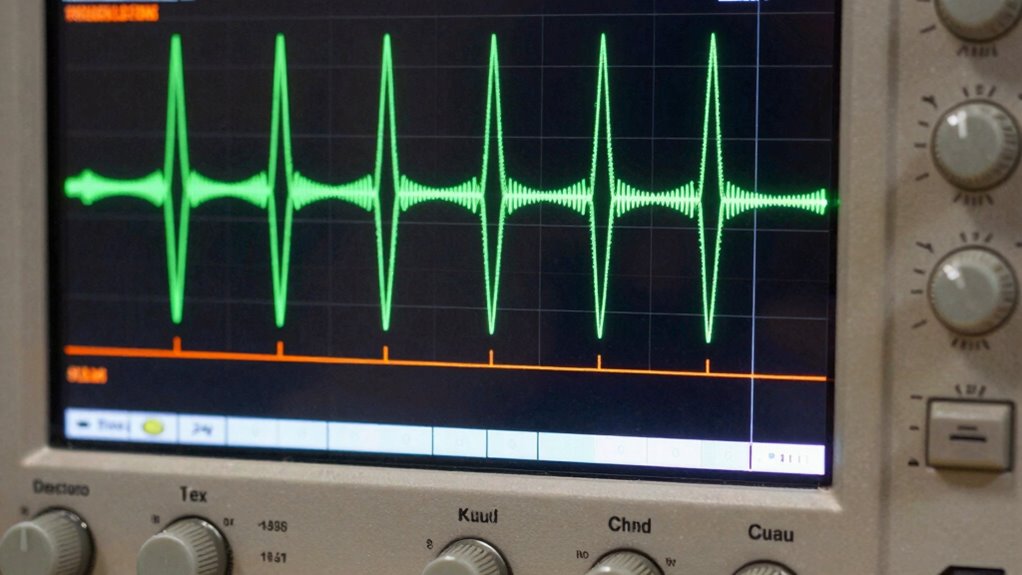
Waveform interpretation isn’t just about reading numbers; it’s about developing an intuitive sense of what the signal’s shape says about its source. For example, a clean sine wave suggests a stable, sinusoidal signal, while irregularities might point to noise or faults. When you learn to interpret these shapes, you can quickly diagnose problems or verify that your circuits work as intended. It’s like learning a new language—once you grasp the basic alphabet, you can understand complex sentences.

DSO 138 DIY Oscilloscope Kit Opening Source 2.4" TFT 1MSPS Digital Oscilloscope Kit with DIY Parts & Probe, Handheld Pocket Sized 13803K, SMD Electronic Learning Set
- Processor Type: ARM Cortex-M3 processor
- Display Size: 2.4-inch color TFT
- Measurement Capabilities: Observe and measure signal waveforms
As an affiliate, we earn on qualifying purchases.
As an affiliate, we earn on qualifying purchases.
Frequently Asked Questions
What Is the Primary Purpose of an Oscilloscope?
The primary purpose of an oscilloscope is to help you analyze signals by visualizing their waveforms. It allows you to see how signals change over time, making it easier to identify issues or characteristics. With waveform visualization, you gain insights into signal behavior, enabling precise troubleshooting and measurement. Fundamentally, an oscilloscope is your tool for detailed signal analysis, helping you understand complex electronic signals quickly and effectively.
How Do I Connect an Oscilloscope to a Circuit?
Connecting an oscilloscope to your circuit is like tuning into a secret conversation. First, make certain your probe is calibrated for accurate readings. Connect the probe’s tip to the point where you want to measure, and attach the grounding clip to a nearby ground point to prevent noise. Double-check connections, then turn on the scope. This setup reveals the hidden details of your signal, making complex waves clear and understandable.
What Are the Different Types of Oscilloscope Signals?
You’ll encounter different signal types like analog, digital, and mixed signals. Analog signals show continuous waveforms with smooth, flowing characteristics, while digital signals display distinct high or low states with sharp shifts. Mixed signals combine both features. Recognizing waveform characteristics helps you interpret these signals accurately. Understanding these types allows you to better analyze circuit behavior, troubleshoot issues, and guarantee your measurements are precise, making your oscilloscope experience less overwhelming.
How Do I Interpret the Vertical and Horizontal Controls?
Waveform analysis starts with understanding the vertical and horizontal controls. You investigate their functions by adjusting the vertical control to set the voltage scale, which shows how tall each wave is, and the horizontal control to set the time base, showing how stretched out the wave appears over time. Using trigger settings guarantees stable signals. Mastering these allows you to interpret signals accurately and confidently, turning complex graphs into clear insights.
What Safety Precautions Should I Take When Using an Oscilloscope?
When using an oscilloscope, prioritize voltage safety by always checking your equipment’s voltage ratings and avoiding contact with high-voltage parts. Use proper grounding techniques to prevent electrical shocks and guarantee accurate readings. Keep your workspace dry and insulated, and wear safety gloves if necessary. Always turn off and unplug the device before making connections or adjustments, and double-check ground connections to avoid potential hazards.
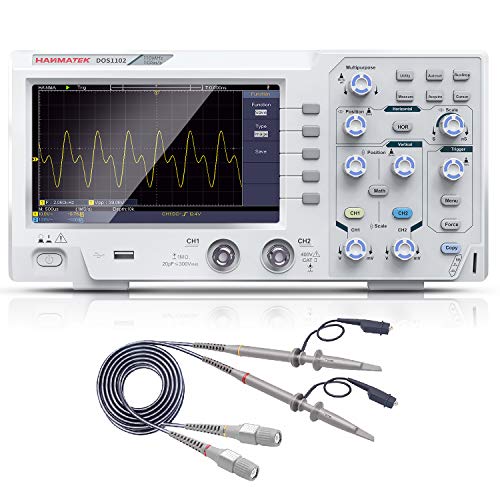
HANMATEK 110mhz Bandwidth DOS1102 Digital Oscilloscope with 2 Channels and Screen 7 inch / 18 cm, TFT-LCD Display, Portable Professional Oscilloscope Kit with 500 MS/s *2 Sampling Rate
- Bandwidth: 110 MHz bandwidth for detailed signals
- Sampling Rate: 500 MS/s dual-channel sampling
- Display: 7-inch TFT LCD with true color
As an affiliate, we earn on qualifying purchases.
As an affiliate, we earn on qualifying purchases.
Conclusion
Think of the first graph on an oscilloscope like a compass guiding you through a stormy sea. Once you understand it, the overwhelming waves of data become navigable, and you’ll find your way with confidence. This simple chart is your lighthouse, illuminating the path to mastering the device. So, don’t shy away—embrace it, and watch how everything else on the scope starts to make sense, turning chaos into clarity.

FNIRSI 2C53T 3-in-1 50MHz 2CH Oscilloscope Multimeter DDS Signal Generator
- Upgraded Version: Enhanced measuring range and added features
- 2-Channel Oscilloscope: 50 MHz bandwidth, 250 MSa/s sampling rate
- Waveform Storage: Supports image storage and export
As an affiliate, we earn on qualifying purchases.
As an affiliate, we earn on qualifying purchases.

MINIWARE Pocket Oscilloscope DS212, Portable Oscilloscope Mini Size Handheld, Built-in Rechargeable Battery, 2 Channels, 1Mhz Bandwidth, Entry Level Oscilloscope for Beginner
- Channels: 2 analog channels
- Bandwidth: 1MHz bandwidth
- Sampling Rate: 10MSa/s sampling rate
As an affiliate, we earn on qualifying purchases.
As an affiliate, we earn on qualifying purchases.